

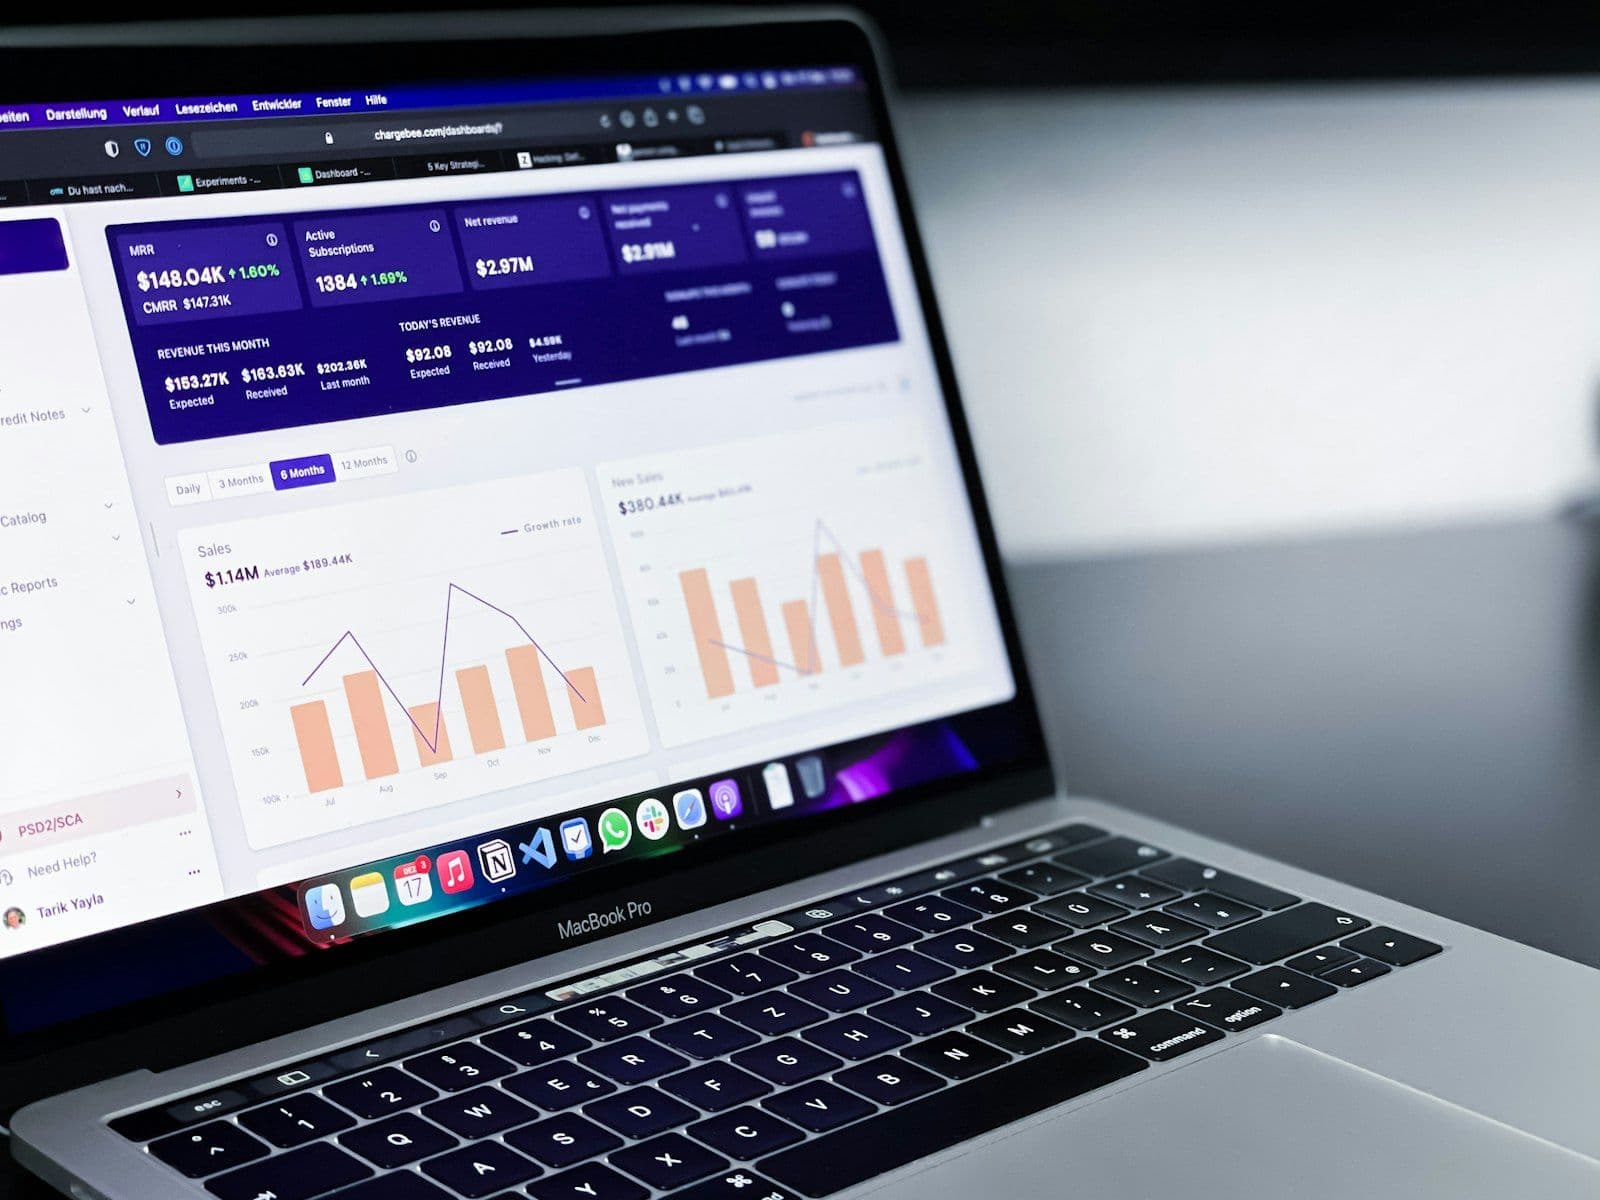
The challenge
A public-sector body handling resident service requests across a number of departments had the underlying data but no way to look at it. Each department ran its own case system, and producing any cross-department view meant asking each one for a spreadsheet, then combining files whose columns, status names, and date conventions did not line up. By the time a combined view existed it described a situation that had already changed.
Analysts were also querying live operational databases directly to build these reports, which put reporting load on the same systems that staff were using to process cases. Heavy month-end queries competed with day-to-day work, so reporting was informally restricted to quiet hours — which in turn made the numbers older still.
Access was the other unresolved problem. Case data contains resident information that most report viewers have no business seeing, but the existing approach was to produce a spreadsheet and control who received it, which is a policy rather than a control.
Our approach
We built a reporting layer separate from the operational systems it draws on. A scheduled pipeline extracts case data from each department's system, maps it onto a shared vocabulary — one set of status values, one definition of when a case opens and closes, one time zone — and writes it into pre-aggregated tables shaped for the questions the dashboard actually asks. Reporting queries hit those tables, so building a report never competes with staff processing a case.
Making the departments comparable was the substantive work, and we treated the mapping as an explicit, reviewable artifact rather than logic buried in a query. Where a department's status has no clean equivalent, that is recorded and shown in the interface rather than quietly folded into the nearest match, because a dashboard that hides its own approximations is worse than one that does not exist. Each view states the point in time its data was extracted, so nobody mistakes a scheduled snapshot for a live figure.
Access is enforced in the data layer, not the presentation layer: a viewer's role determines which departments and which level of aggregation they can query, and views intended for general circulation are built from aggregates that never carry resident-identifying fields at all. The interface is fully bilingual with right-to-left layout, which for charts meant handling axis direction, numeral rendering, and label placement properly rather than mirroring a left-to-right design and hoping the result reads.
Outcome
The body now has one cross-department view of service-request activity built on a shared set of definitions, instead of spreadsheets assembled on request. Reporting no longer runs against the systems staff use to process cases, and who can see what is enforced by the query layer rather than by controlling distribution of a file.